Leverage the power of geographic and demographic data using MSG's full suite of GIS & GEO-DEM services. We offer demographic data, reports, maps, geocoding, spatial analytics, custom geographic frame designs, Census 2010 info and much more. From simple maps and reports to multifaceted data, spatial projects, and custom consulting, MSG's highly skilled GIS group has you covered.
Reports and Mapping
There is often no better way to illustrate valuable insight about your target geography than through reports and maps. These essential tools will help you make informed business decisions, quickly and easily. Our data sources include up-to-date demographics, census, and postal geographies, all of which provide the most accurate data available.
- Reports and maps are available as standalone products or can be bundled together at a discounted price.
- Enhance reports by adding additional demographic or geographic variables from one of our many data sets.
- Multiple geographies of the same report type can be provided individually or aggregated into a single report.
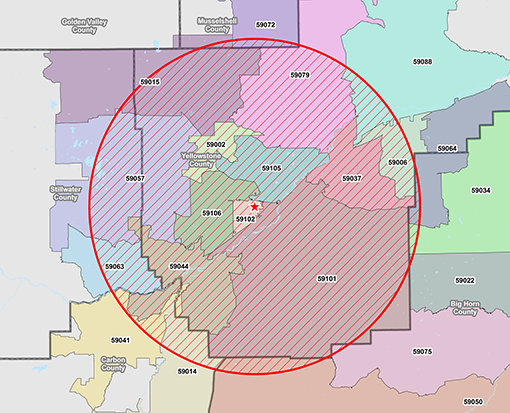
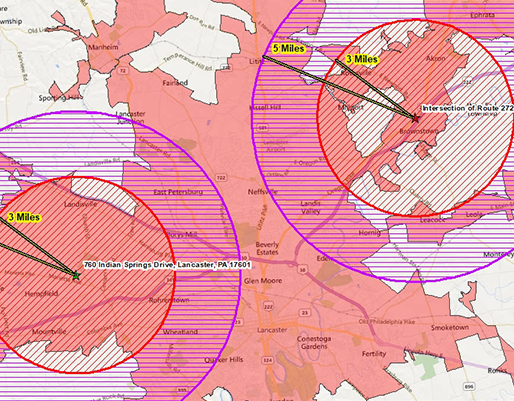
A 25-mile radius from the centroid of billings, MT provides a local government agency with up-to-date population and household counts for ZIP code areas (within the 25-mile area).
Reports
Demographic Reports: Provide an address, geography, or set of geographic coordinates to generate a report on the demographic characteristics for the area of interest. Choose from a variety of methods, including radius, drive time, custom defined areas, geo-within-geo, and much more.
Batch Reports: Need to order a high volume of reports at the same time? There is no limit to the number of reports we can handle at a given time. We specialize in high volume orders and offer a variety of batch reporting options.
Mapping
Whether you’re in market research, real estate, retail or some other industry, maps are essential for illustrating and identifying hidden patterns and trends within your industry data. Maps can be important aids for making correct business decisions. MSG has the expertise and software to produce various types of maps including:
- Choropleth (Heat) Maps – Color code demographic or other data to illustrate differences within a specific geography.
- Radius Mapping – Analyze or illustrate characteristics within a predefined radius around any location(s).
- Drive Time Mapping – Define a custom geography based on travel time to/from a location which then could be further analyzed.
- Custom Mapping – Create custom geographic areas or display customer locations.
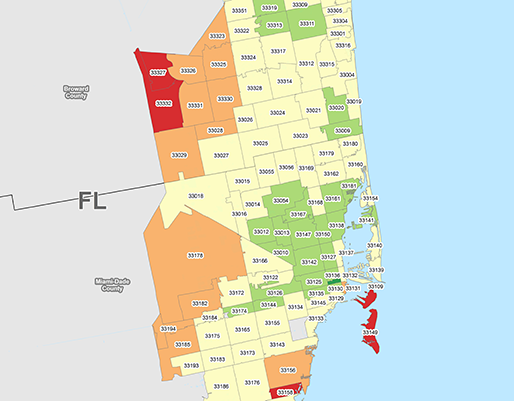
This Miami map with zip codes shows median household income.
Additionally, maps can be produced for any level of census, postal, or customer defined geographic area. Printed versions of maps can be provided as well as files for large-format printing. Electronic files can be produced in a variety of formats including .PDF, .JPEG, and shape files. Contact one of our representatives today. Let us help you decide the best way to display your data.
Map the location of current and potential customers to target areas with the greatest market potential for increased sales.
Geo-Coding
MSG offers sophisticated geo-coding services which can accurately identify the physical location of an individual address. The process utilizes a hierarchal set of custom-built address locators that reference various sources of public and third party street datasets which are constantly updated to reflect on-going changes made to postal codes by the USPS.
Minimally, each geo-coded address has latitude/longitude and a precision level appended to it. Additional information such as Census geography can be appended once the latitude and longitude are determined.
Interpolated Geo-Coding: Address street segments, such a hundred block, a portion of a street between intersections, or a portion of a street between geo-features such as bodies of water, railways, divided highways, etc., are divided up into evenly sized intervals based on the min-max range of the house numbers within that segment. Each physical primary address within that interval receives a latitude/longitude based on the pre-determined interval locations. All secondary addresses (i.e., apartments, lots, etc.) inherit the geocodes of the primary street address.
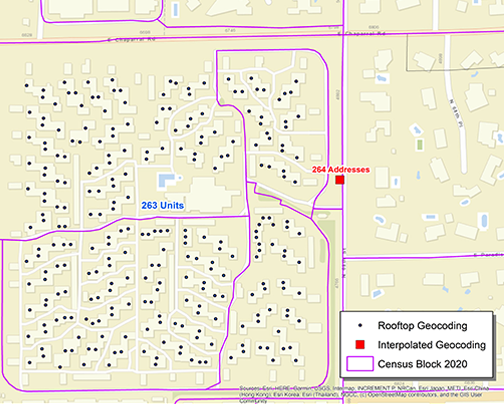
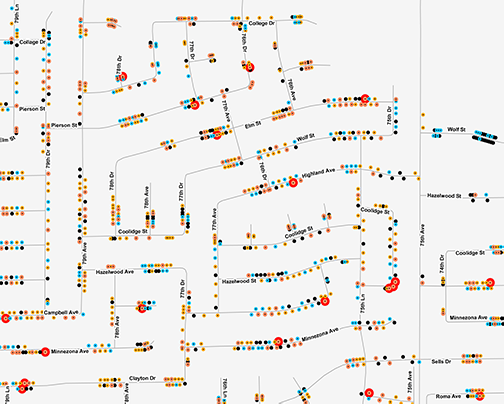
Example illustrating differences between interpolated and rooftop geocoding methodologies, where the purple lines are Census Block boundaries, the BLACK dots represent the rooftop geocodes, and the RED square is the single interpolated geocode.
Roof Top Geo-Coding: A recent improvement to MSG’s geocoding capabilities, roof top geocoding provides the latitude and longitude of the physical location of structures (houses, trailers, apartment buildings, etc.). Unlike the interpolated methodology, roof top geocoding provides separate latitude and longitudes for secondary street addresses, such as each individual lot associated with a trailer park. Roof top geocoding improves the accuracy of the geocodes appended to postal addresses, especially for large sprawling apartment complexes and mobile home/trailer parks.
Address Locators: MSG’s custom-built address locators reference both multiple street-segment databases (interpolated) and point specific databases (roof top) to accurately identify the location of any address, street intersection, alias name, or ZIP+4 centroid in the US.
MSG's geocoding process steps through the various methods in a hierarchical fashion - most accurate to least accurate. An address is geocoded by first checking the roof top sources, followed by checking the interpolated sources, and then finally using the centroid-based sources. Every address receives a precision code denoting the level of the geocoding used
If your address list is missing pertinent information, MSG has the ability to fill in the missing information and match the addresses to the best level of geographic precision possible. With more than 99% of the U.S. addresses in the U.S. already geocoded and continuously updated, we’re confident we know where your addresses are located. Contact us today for more information.
Map the location of current and potential customers to target areas with the greatest market potential for increased sales.
Demographic Data: Generate demographic reports which describe the geographic area of interest.
Data Cleanup: Bad data has a nasty habit of creeping into datasets, especially large ones. Examples include ZIP code changes and street name aliases, and misspelled street names. Avoid errors by letting MSG's Geodemographers validate and cleanup your records using the latest and most comprehensive street segment datasets.
Data Conversions: Geocoded data can be provided in a variety of formats for use in GIS / Data Science software systems.
Expert Consulting: Our team has over 25 years of combined expertise in GIS / Data Science, Demography, and Spatial Analysis. We specialize in Ad-Hoc GIS solutions. We understand that each order has unique requirements and tailor every solution.
Spatial Analytics
MSG offers a variety of analytical and consulting services to satisfy any project need. Our highly skilled staff has the expertise and technical infrastructure already in place to provide you with the GIS support your company seeks. Whether it’s impact studies, spatial analytics, market research, site selection, suitability studies, competitive intelligence, disaster planning and response - tell us the kind of reporting and mapping you need and we will deliver it.
Service areas. We perform spatial analysis and data visualization for an array of business and government sectors:
- Business (market research, customer prospecting, market area)
- Public Safety & Emergency Management
- Transportation
- Utilities & Communications
- Health & Human Services
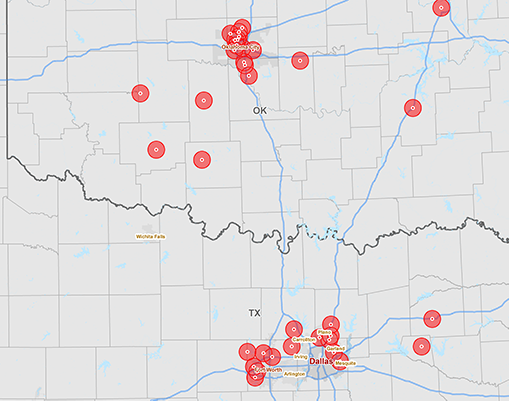
After completing the first process of the competitive intelligence model, competitors with the highest threat score are identified and go through the second stage of the competitive intelligence model. This map shows competitor locations posing the greatest threat. A specified radius ring is created around each competitor location to determine their proximity to the client's service area.
Natural Disaster Studies: Need to identify a population affected by a natural disaster? We source the most current data from FEMA and other government agencies to provide you with precision geography down to the census block level.
Suitability Mapping and Modeling: Seeking the ideal location for a new retail site? Looking for the best location for a new highway? MSG applies the latest spatial modeling methods for land use and site suitability studies.
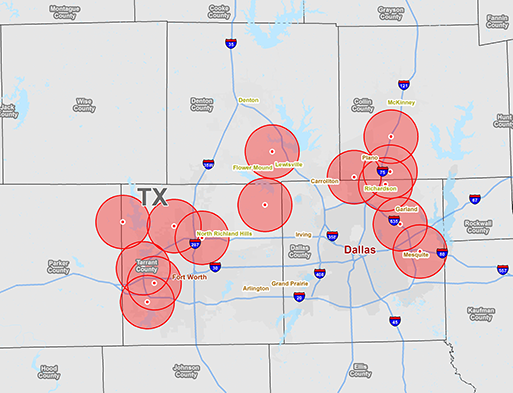
The final step in the competitive intelligence model identifies competitor locations within the client's service area with the highest overall threat score. This map displays competitor locations with the highest threat scores in the Dallas/Fort Worth TX area.
Demographic Data
Data is ubiquitous in today’s world and MSG has access to a wide range of demographic and other reference datasets. Our Geo-demographers offer the convenience of finding and using the most up to date data available for your individual project needs. The subject matter of the data sources we routinely access include demographics, economics, government, crime data, transportation, POI, healthcare, and many others. Information can be provided for a pre-defined geography (i.e. Census and Postal) as well as just about any custom geography. Some frequency used data sources include:
- US Census American Community Survey (ACS) 5 Year Estimates – The ACS is an ongoing survey that provides vital and detailed population and housing information about the US on an annual basis. A wealth of aggregated Census demographic data is available at the Census block group and Census tract level up to the national level.
- Public Use Microdata Areas (PUMAs) – are non-overlapping, statistical geographic areas that partition each state or equivalent entity into geographic areas containing no fewer than 100,000 people each. They cover the entirety of the United States, Puerto Rico, and Guam. The Census Bureau defines PUMAs for the tabulation and dissemination of decennial census and American Community Survey (ACS) Public Use Microdata Sample (PUMS) data. Additionally, the ACS and Puerto Rico Community Survey use them to disseminate their respective period estimates. The delineation of new PUMAs occurs after the completion of the decennial census as part of a program involving the State Data Centers (SDCs). Decennial census population counts and updated census tracts are critical inputs into the delineation process. From a geography perspective, PUMAs are wholly contained within states and PUMA boundaries do not cross state boundaries. Census tracts are the building blocks for PUMAs, so all PUMAs are defined by census tract geography. Census tracts do not cross PUMA boundaries.
- Current Population Survey (CPS) – CPS is a monthly survey of households conducted by the US Census for the Bureau of Labor Statistics. It provides comprehensive data on the US labor force, employment, unemployment, as well as other demographic and labor force characteristics.
- County Business Patterns (CBP) - an annual dataset that provides subnational economic data by industry. CBP data provides statistics on the number of businesses and establishments, number of employees, and payroll for micro level geographic areas making this dataset a valuable source for those interested analyzing the economic health and market potential of a community.
The final step in the competitive intelligence model identifies competitor locations within the client's service area with the highest overall threat score. This map displays competitor locations with the highest threat scores in the Dallas/Fort Worth TX area.
Static Mapping
MSG provides enhanced mapping capabilities. Custom maps can be produced for any level of geography with demographic and client specific overlays. Maps typically contain geographic, street, and natural boundaries and can include demographic and/or client-supplied overlays. Examples can be found in the Resource Center.
- Electronic files can be produced in a variety of formats including PDF, JPEG, and ESRI shape files.
- Printed versions of maps can be provided as well as files formated for large-format printing.
- Maps of all kinds can be obtained by contacting one of our account representatives via email or telephone.
Geographic Information Systems (GIS)
From simple maps and reports to multifaceted data, spatial projects, and custom consulting, MSG's Geographic Information Systems (GIS) group has you covered for Geospatial Services. Leverage the power of geographic and demographic data using MSG's full suite of GIS services. GIS can be designed to capture, store, manipulate, analyze, manage, and present all types of spatial or geographical data.

A geographic information system (GIS) integrates hardware, software, and data for capturing, managing, analyzing, and displaying all forms of geographically referenced information. GIS allows us to view, understand, question, interpret, and visualize data in many ways that reveal relationships, patterns, and trends in the form of maps, globes, reports, and charts.
- Reports and Maps for any geography using the latest Census, Postal and demographic data provide valuable insight into the characteristics of your target geography.
- Geocoding pinpoints addresses via comprehensive GIS street segment data, down to the household level. Need additional Census and household level demographics? We'll provide that, too. Available for the United States, Guam, Virgin Islands, Puerto Rico, and more.
- Spatial Analytics by our highly skilled staff, provide you with the GIS support your company seeks: impact studies, market research, site selection, suitability studies, competitive intelligence, disaster planning and response - tell us what you need, and we deliver.