Create a new project or open an existing project.
Create a new cell and define the geography, or open an existing cell with the geography already defined.
Click the PRIZM Code button  .
.
The PRIZM module defines the sampling frame by including only those exchanges that meet the criteria of a specific PRIZM cluster. First, select a set of cluster codes for an existing geographic cell. Second, generate a PRIZM coverage report. A cutoff is then applied based on the coverage and incidence for the project.
The PRIZM cluster system is a social-economic coding scheme consisting of 66 cluster codes developed and maintained by www.Claritas.com (a marketing information resources company). The Virtual Genesys PRIZM module maintains a household distribution across these 66 cluster codes for each residential exchange.
To perform a PRIZM overlay
Create a new project or open an existing project.
Create a new cell and define the geography, or open an existing cell with the geography already defined.
Click the PRIZM Code button .
-- or --
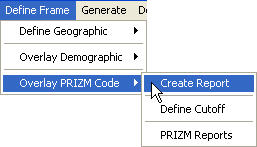
On the Define Frame menu, point to Overlay PRIZM Code, then clickCreate Report.
A PRIZM Code dialog box opens.
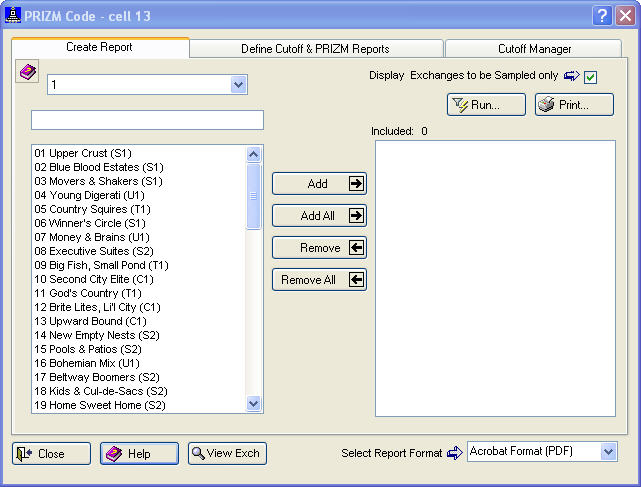
The Create Report tab is selected. The cell name is displayed in the title bar.
Add ![]() ,Add All
,Add All  ,Remove
  , andRemove All
  are provided for convenience.
Define the cell's geography.
To select a PRIZM Code and move it into the Included box
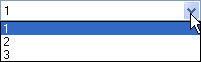
Use the first box to select a number, 1 through 3. The number 1 contains PRIZM Codes primary to that State, 2 contains PRIZM Codes secondary to that State, and so forth.
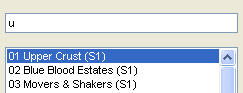
Use the second box to search for a PRIZM Code. Type in the first character or two.
Do one of the following:
Click once on an item, then click Include  .
.
Click twice (double-click) on an item.
Repeat for all PRIZM Codes being added.
The Display Exchanges to be Sampled only check box is selected by default. 
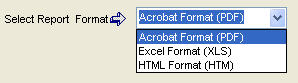
Click Select Report Format to select a format for the report (PDF, XLS, or HTM).
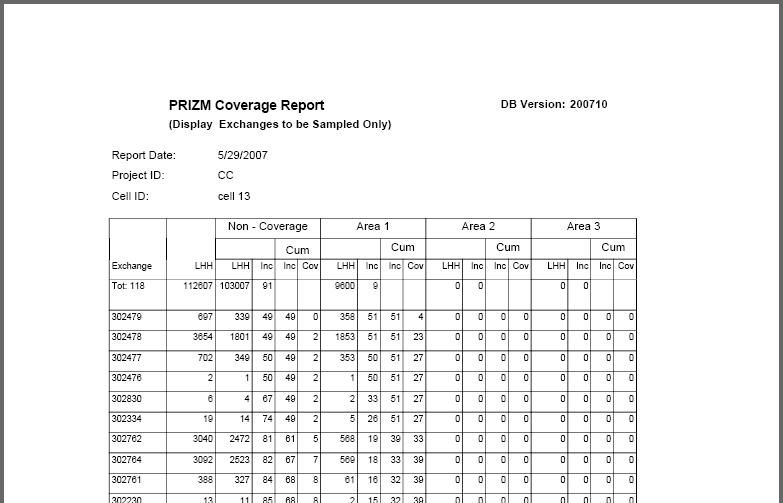
Click Run  to create the report. A PRIZM Coverage Report opens.
After reviewing the generated report, a cutoff must be defined and applied. The cutoff can be applied under theDefine Cutoff & PRIZM Reports tab or by using the Cutoff Manager. To define a cutoff in the Reports tab, type the Minimum andMaximum Acceptable Incidences into their respective boxes, or accept the defaults, and then clickApply  . A message displays the number of original exchanges, the number excluded, and the number retained.
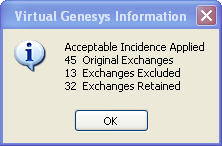
(Click OK  .)
.)
Click the Define Cutoff & PRIZM Reports tab.
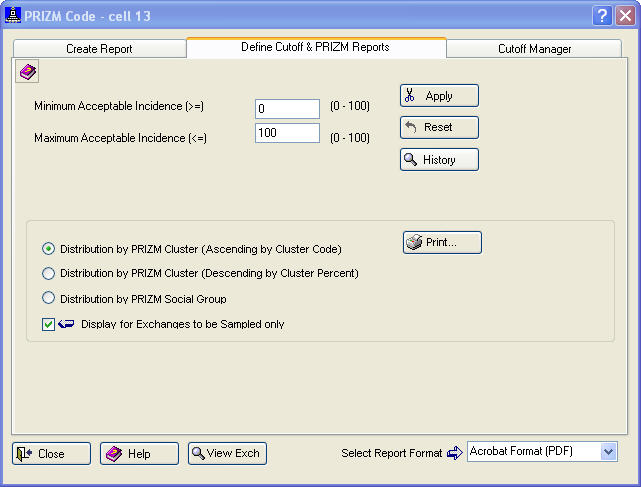
Type the Minimum andMaximum Acceptable Incidences into their respective boxes, or accept the defaults.
Click Apply . A message displays the original number of exchanges, the number excluded, and the number retained.
(Click OK .)
Click Reset  to reset the cutoff. This removes any applied cutoffs and restores any exchanges that were excluded.
Click History  to generate a history of applied cutoffs.
A PRIZM Report can be displayed in three different formats. Click one of the options.
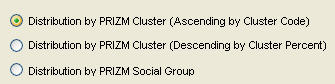
The Display for Exchanges to be Sampled only check box is selected by default.
Click Select Report Format to select a format for the report (PDF, XLS, or HTM).
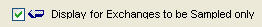
Click Print  . A PRIZM Cluster Distribution Report opens.
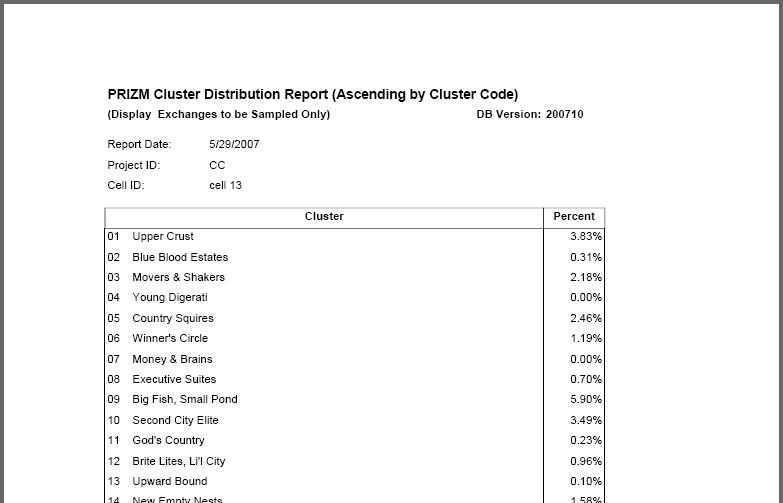
To apply a cutoff using the Cutoff Manager, move either the Incidence or Coverage slider. Moving one affects the other. For numeric percentage information on where the sliders are located and how this affects the sampling frame, see the Incidence and Coverage display  in the upper right corner.
Click Apply . A message displays the original number of exchanges, the number excluded, and the number retained.
(Click OK .)
Click Reset to remove the demographic overlay for the current category.
Click History  to generate a history of applied demographic overlays.
After creating the coverage report and applying the cutoff, click View Exch  to view the exchanges retrieved. A View Exchanges dialog box opens.
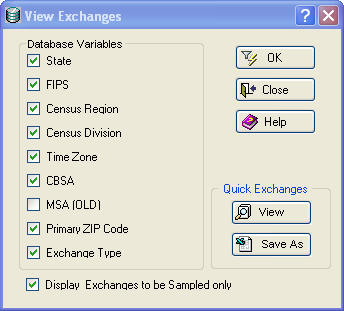
Under Database Variables, select the variables to be included in the Exchange Report.
Under Quick Exchanges, View  and Save As
  allow the data to be viewed or saved.
The Display Exchanges to be Sampled only option is checked by default.
Click OK  . A View Exchanges to be Sampled Report opens.
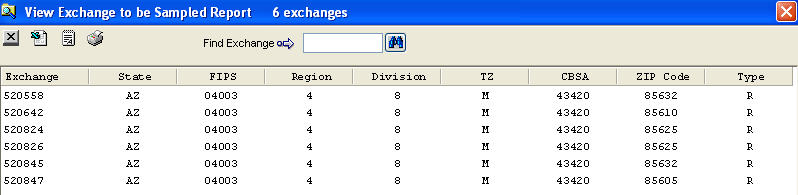
The report can be printed, or saved as an RTF (Rich Text Format) or ASCII file.