Create a new project or open an existing one.
Create a new cell and define the geography, or open an existing cell with predefined geography.
Click the Demographic button  .
.
The Demographic module provides the ability to narrow the set of exchanges that defines the sampling frame by including only those that meet specific demographic criteria. Demographic distributions and demographic medians are the two ways of targeting demographics in Virtual Genesys.
A demographic distribution report targets one of the following five demographic categories:
Age of Population (Age)
Race of Population (Race)
Household Income (Income)
Percent of Housing Occupancy (Home)
Percent of College Graduates (Education)
The report classifies each exchange into 5 percent incidence breaks based on the exchange's distribution of households across the selected demographic. This incidence can be changed to 1 percent in the report by selecting the 1% Increments check box. A cutoff is then applied on the set of exchanges that best suits the objectives of the project.
A demographic median report selects exchanges by targeting one of the following four median demographic values assigned to each exchange:
Average Rent
Median Income
Median Home Value
Median Years of Education
Exchanges are selected by specifying a range of values for the selected variable that best suits the objectives of the project.
Each demographic category is broken down into several variables and their ranges. See table of Categories and Breaks. To perform a demographic overlay:
Create a new project or open an existing one.
Create a new cell and define the geography, or open an existing cell with predefined geography.
Click the Demographic button .
-- or --
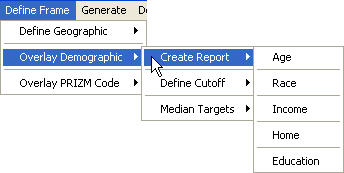
On the Define Frame menu, point to Overlay Demographic, then to Create Report, and then click Age, Race, Income, Home, or Education.
A Demographic dialog box opens at the Create Report & Define Cutoff tab.
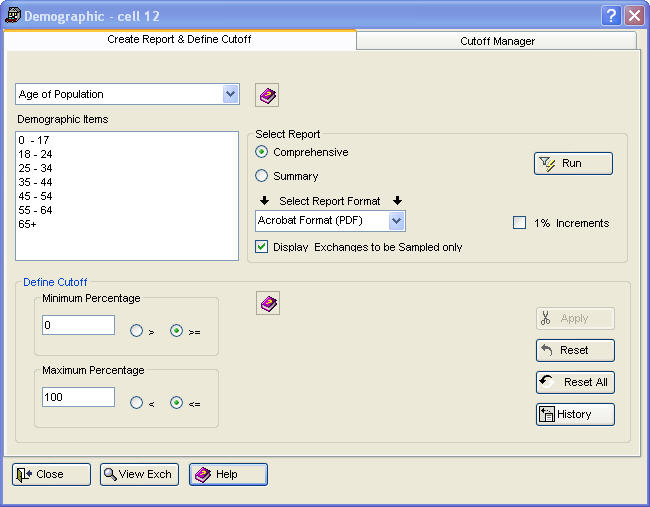
The demographic category (Age of Population, in this case) appears in the Demographic Types list. This category can be changed. Click a new demographic category. Different options for that demographic appear in the Demographic Items box.
Click items under Demographic Items.
Under Select Report, click Comprehensive or Summary.
Comprehensive Report
The comprehensive report provides information in 5 percent cutoff intervals (or incidence breaks). These intervals range from 100 percent (highest incidence/lowest coverage) down to 0 percent (lowest incidence/highest coverage). The 5 percent cutoff interval is the default. The cutoff interval can be changed to 1 percent in the report by selecting the 1% Increments check box. The comprehensive report provides the following information:
Number of Exchanges: Lists the number and percent of exchanges that are included in the frame at the individual cutoff level.
Cumulative Exchanges: Lists the total number of exchanges at the specific cutoff level.
Target: Provides the estimated number of target households, coverage, and incidence at the individual cutoff level.
Cumulative Target: Provides the total estimated number of target households, cumulative coverage, and cumulative incidence. These are the figures of most importance in determining where a cutoff should be applied.
Non-Target: Lists the estimated number of non-target households, coverage, and incidence at the individual cutoff level.
Cumulative Non-Target: Provides the total estimated number of non-target households, coverage, and incidence at the specific cutoff level.
Household: Lists the number of total households and coverage at the individual cutoff level.
Cumulative Households: Provides the total number of total households and coverage at the specific cutoff level.
Summary Report
The summary report lists the cumulative incidence and coverage figures for each of the 5 percent cutoff intervals. This cutoff interval is the default. The cutoff can be changed to 1 percent in the report by selecting the 1% Increments check box.
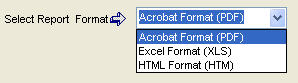
Click Select Report Format and select a format (PDF, XLS, or HTM).
Click Run  to compile the report.
A cutoff value must be defined once the demographic distribution report has been reviewed. A cutoff can be defined and applied on either the Create Report & Define Cutoff tab or the Cutoff Manager tab.
On the Create Report & Define Cutoff tab, type the minimum acceptable percentage.
Type the maximum acceptable percentage. The default value is 100.
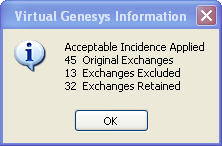
Click Apply  . A message displays the original number of exchanges, the number excluded, and the number retained.
Click Reset  to remove the demographic overlay for the current category. Click Reset All
  to remove the demographic overlay for all categories. Both actions restore any exchanges that were excluded for the respective overlay.
Click History  to generate a history of applied demographic overlays.
To use the Cutoff Manager, move either the Cutoff or Coverage slider. Moving one affects the other. For numeric percentage information on where the sliders are located and how this affects the sampling frame, see the Incidence and Coverage display  in the upper right corner.
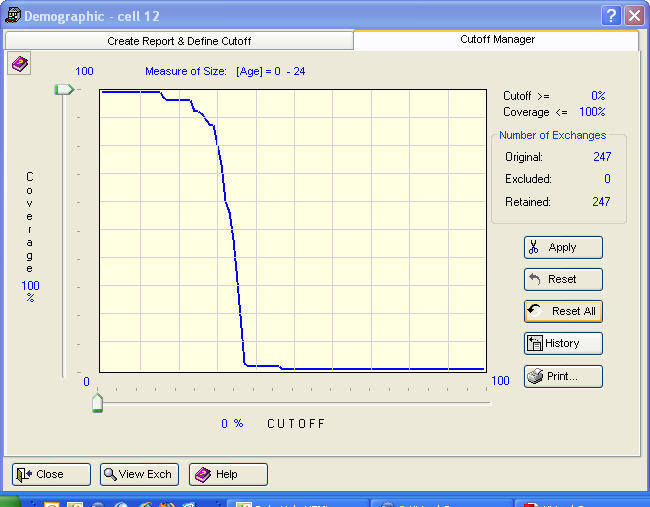
Click Apply . A message displays the original number of exchanges, the number excluded, and the number retained.
Click Reset to remove the demographic overlay for the current category. Click Reset All to remove the demographic overlay for all categories. Both actions will restore any exchanges that were excluded for the respective overlay.
Click History to generate a history of applied demographic overlays.
Click Print  to print an image of the overlay.
Age and Race demographics are population-based variables derived from current year estimates. The Income and Housing Occupancy demographics are household-based variables derived from current year estimates. Percent College Graduates is based on a population at least 18 years old.
|
Age |
Income |
Race |
Percent Housing Occupancy |
Education |
|
|
|
|
|
|
|
0-17 |
0 < 10,000 |
Asian/Pacific Islander |
Owner-Occupied |
Percent College Grads |
|
18-24 |
10,000 < 15,000 |
Black (non-Hispanic) |
Rented/Other |
|
|
25-34 |
15,000 < 25,000 |
Hispanic |
|
|
|
35-44 |
25,000 < 35,000 |
White (non-Hispanic) |
|
|
|
45-54 |
35,000 < 50,000 |
|
|
|
|
55-64 |
50,000 < 75,000 |
|
|
|
|
65 Plus |
75,000 < 100,000 |
|
|
|
|
|
100,000 Plus |
|
|
|
To select exchanges by targeting one of the median demographic values:
Create a new project or open an existing one.
Create a new cell and define the geography, or open an existing cell with predefined geography.
Click the Demographic Median Targets button  .
.
-- or --
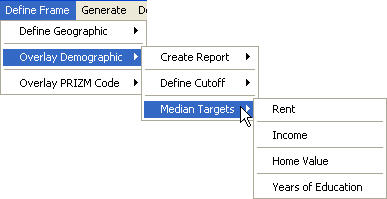
On the Define Frame menu, point to Overlay Demographic, then to Median Targets, and then click Rent, Income, Home Value, or Years of Education.
Type the minimum and maximum values into the boxes for Minimum $ and Maximum $.
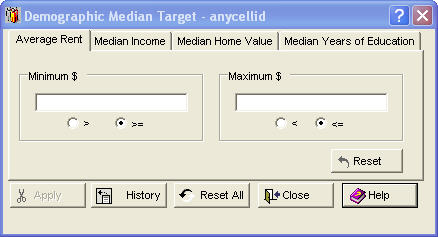
Apply appears dimmed until Minimum $ and Maximum $ are filled in. Apply then becomes available.
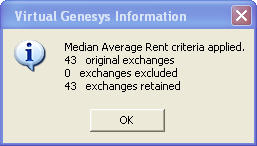
Click Apply . A message displays the original number of exchanges, the number excluded, and the number retained.
( Click OK  .)
.)
Click Reset to remove the demographic overlay for the current category. Click Reset All to remove the demographic overlay for all categories. Both actions restore any exchanges excluded for the respective overlay. Click History to generate a history of applied demographic overlays.
ClickClose ![]() to close the Demographic Median Target dialog box.
to close the Demographic Median Target dialog box.